Web Dashboard 🔗
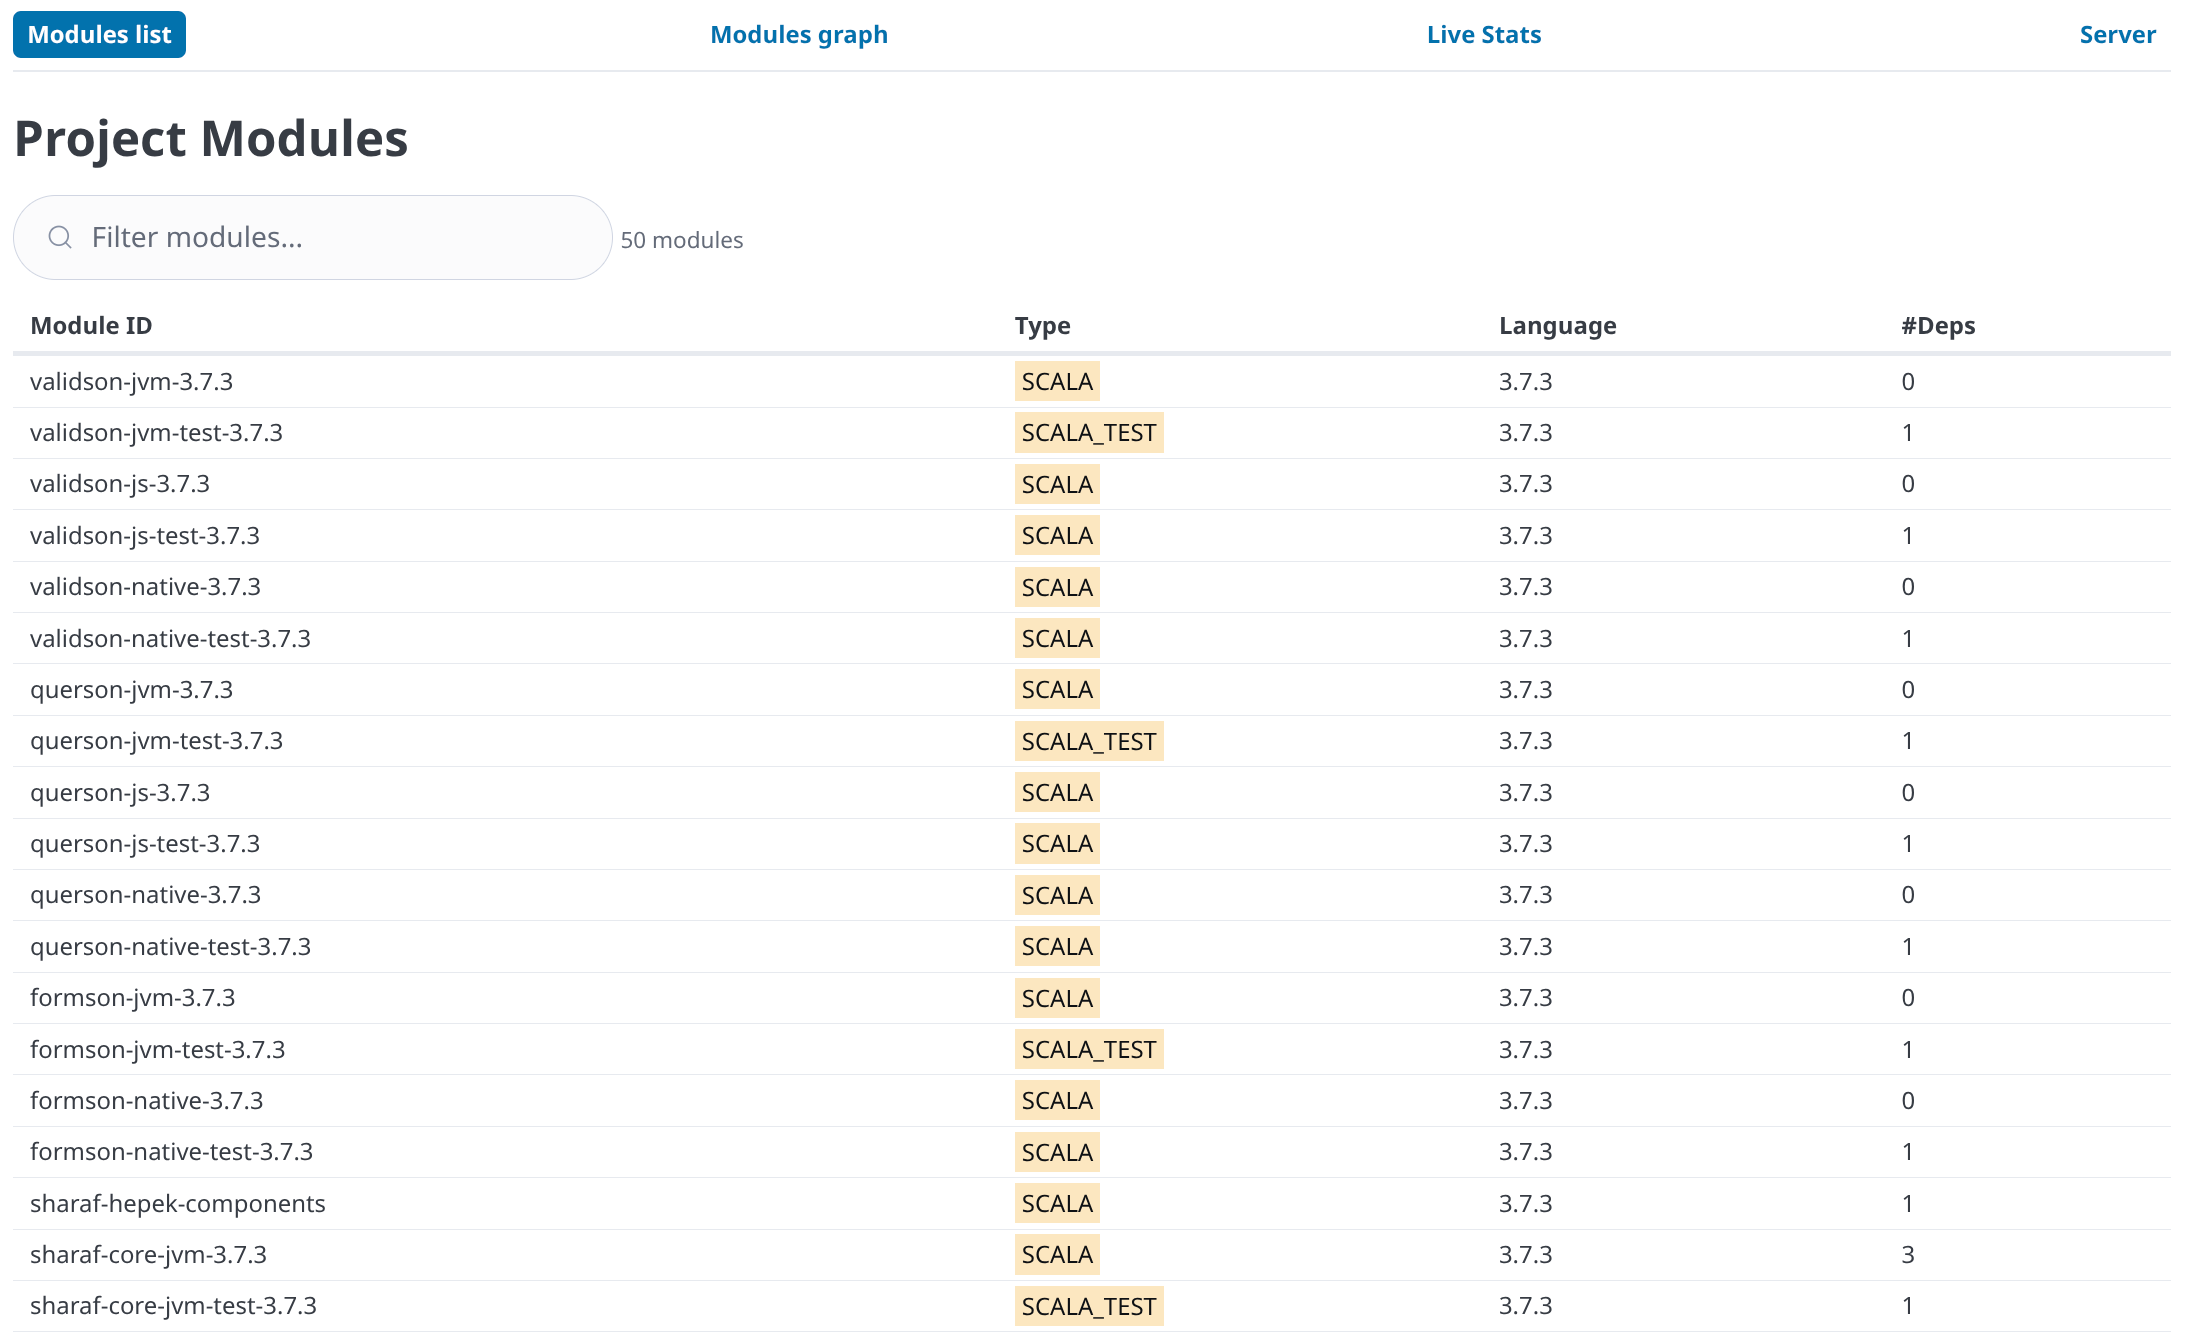
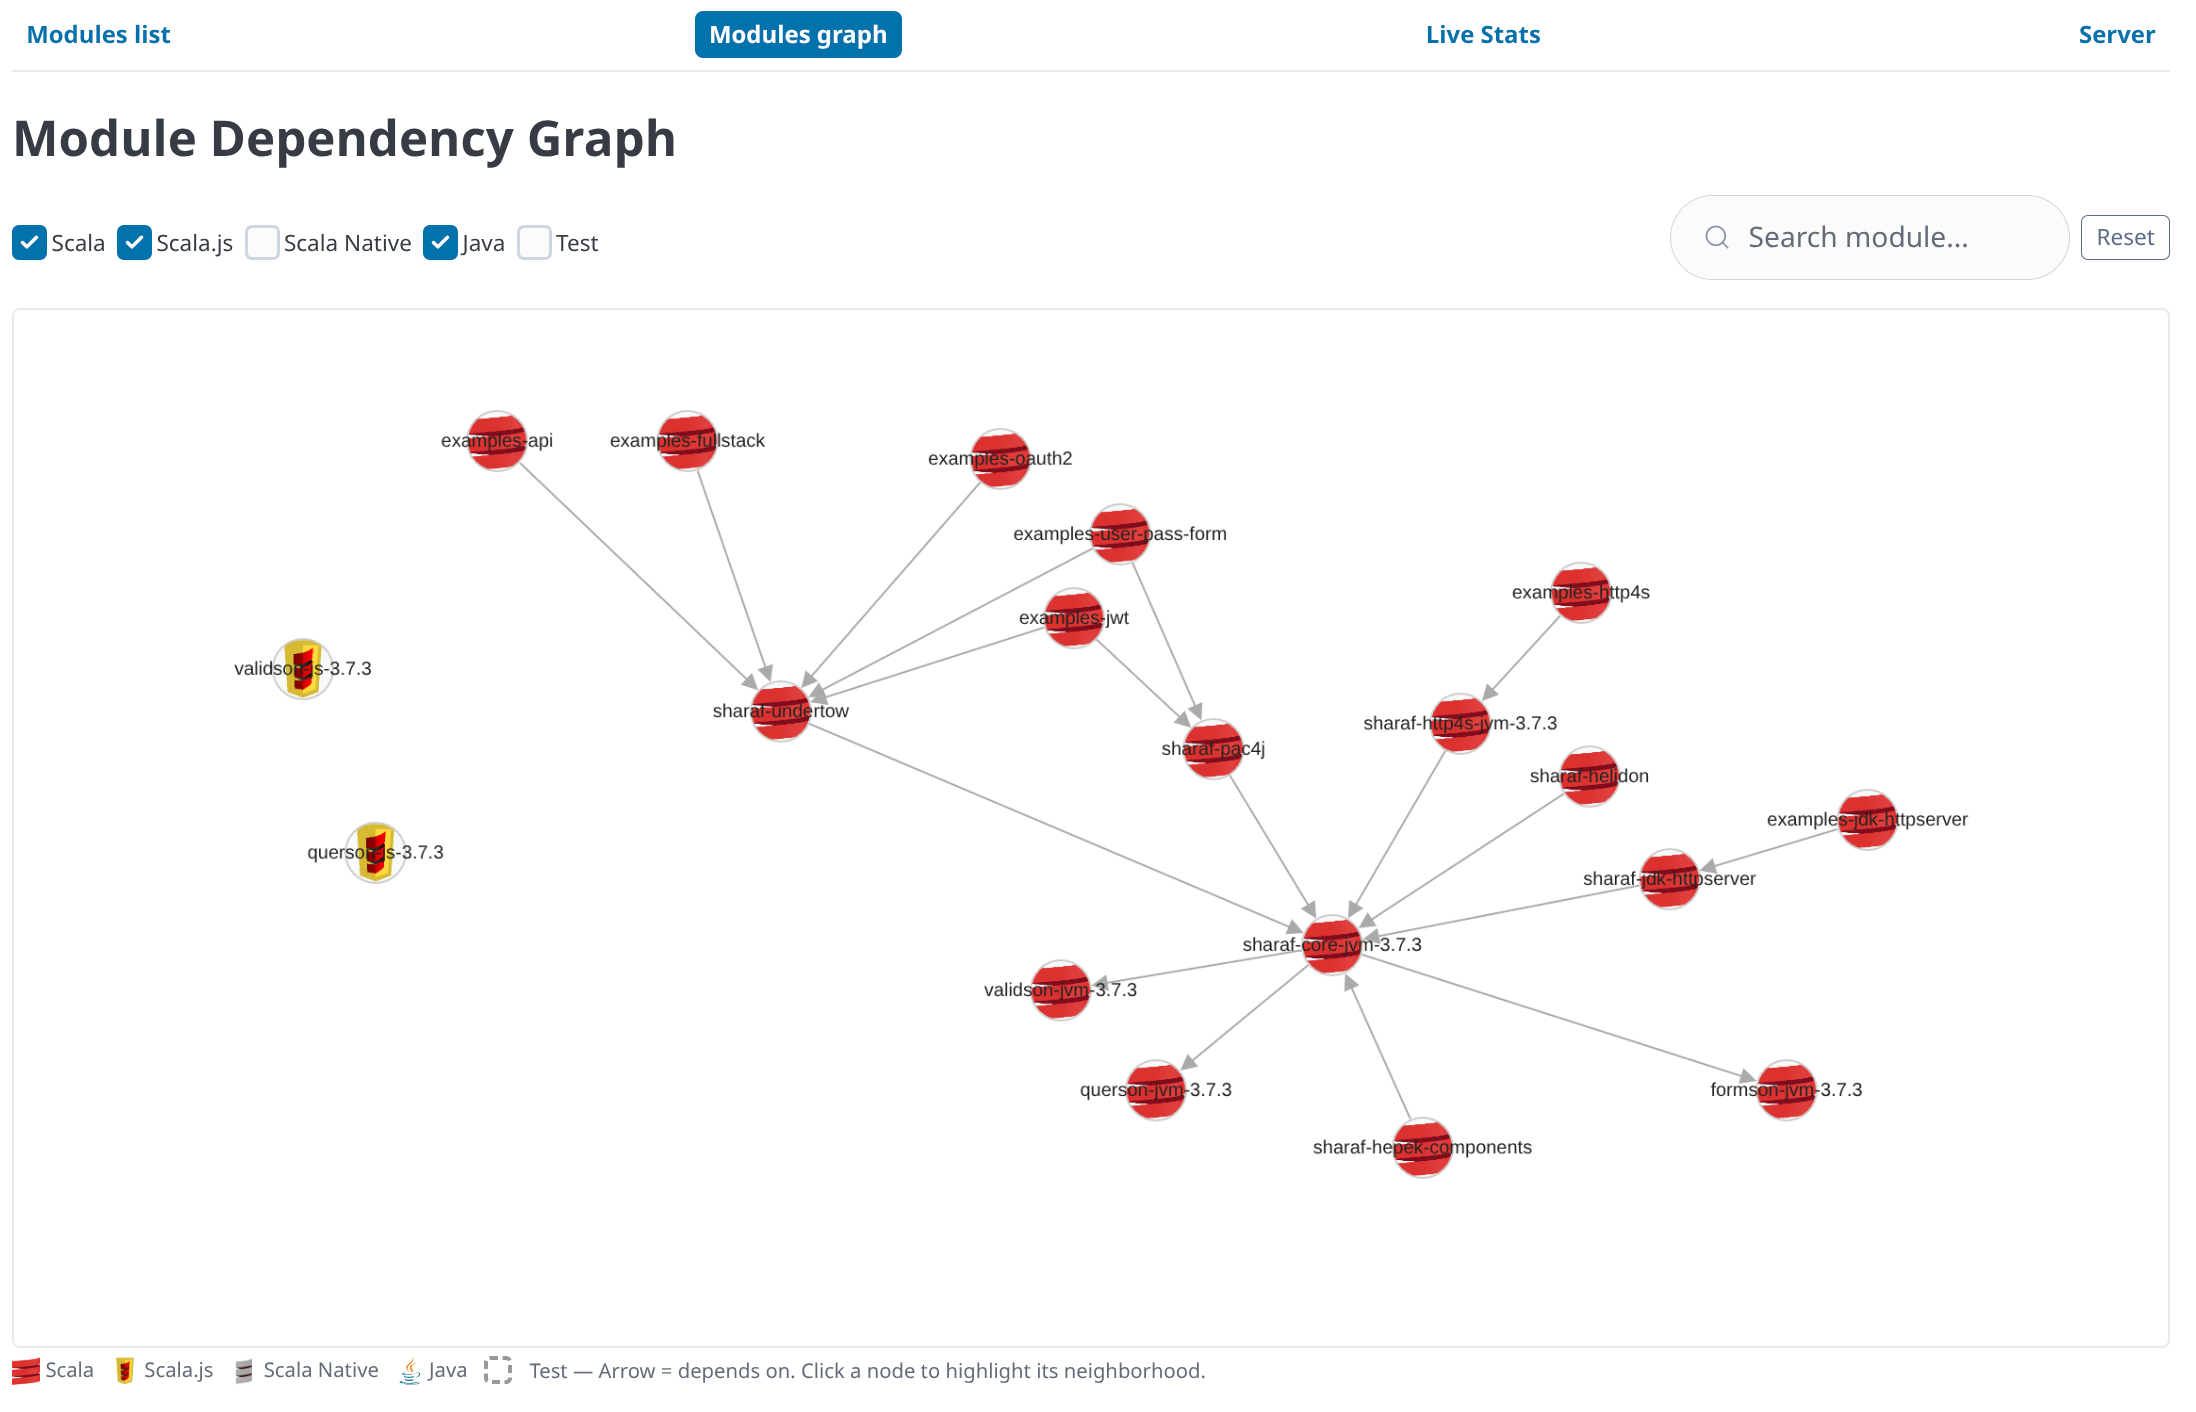
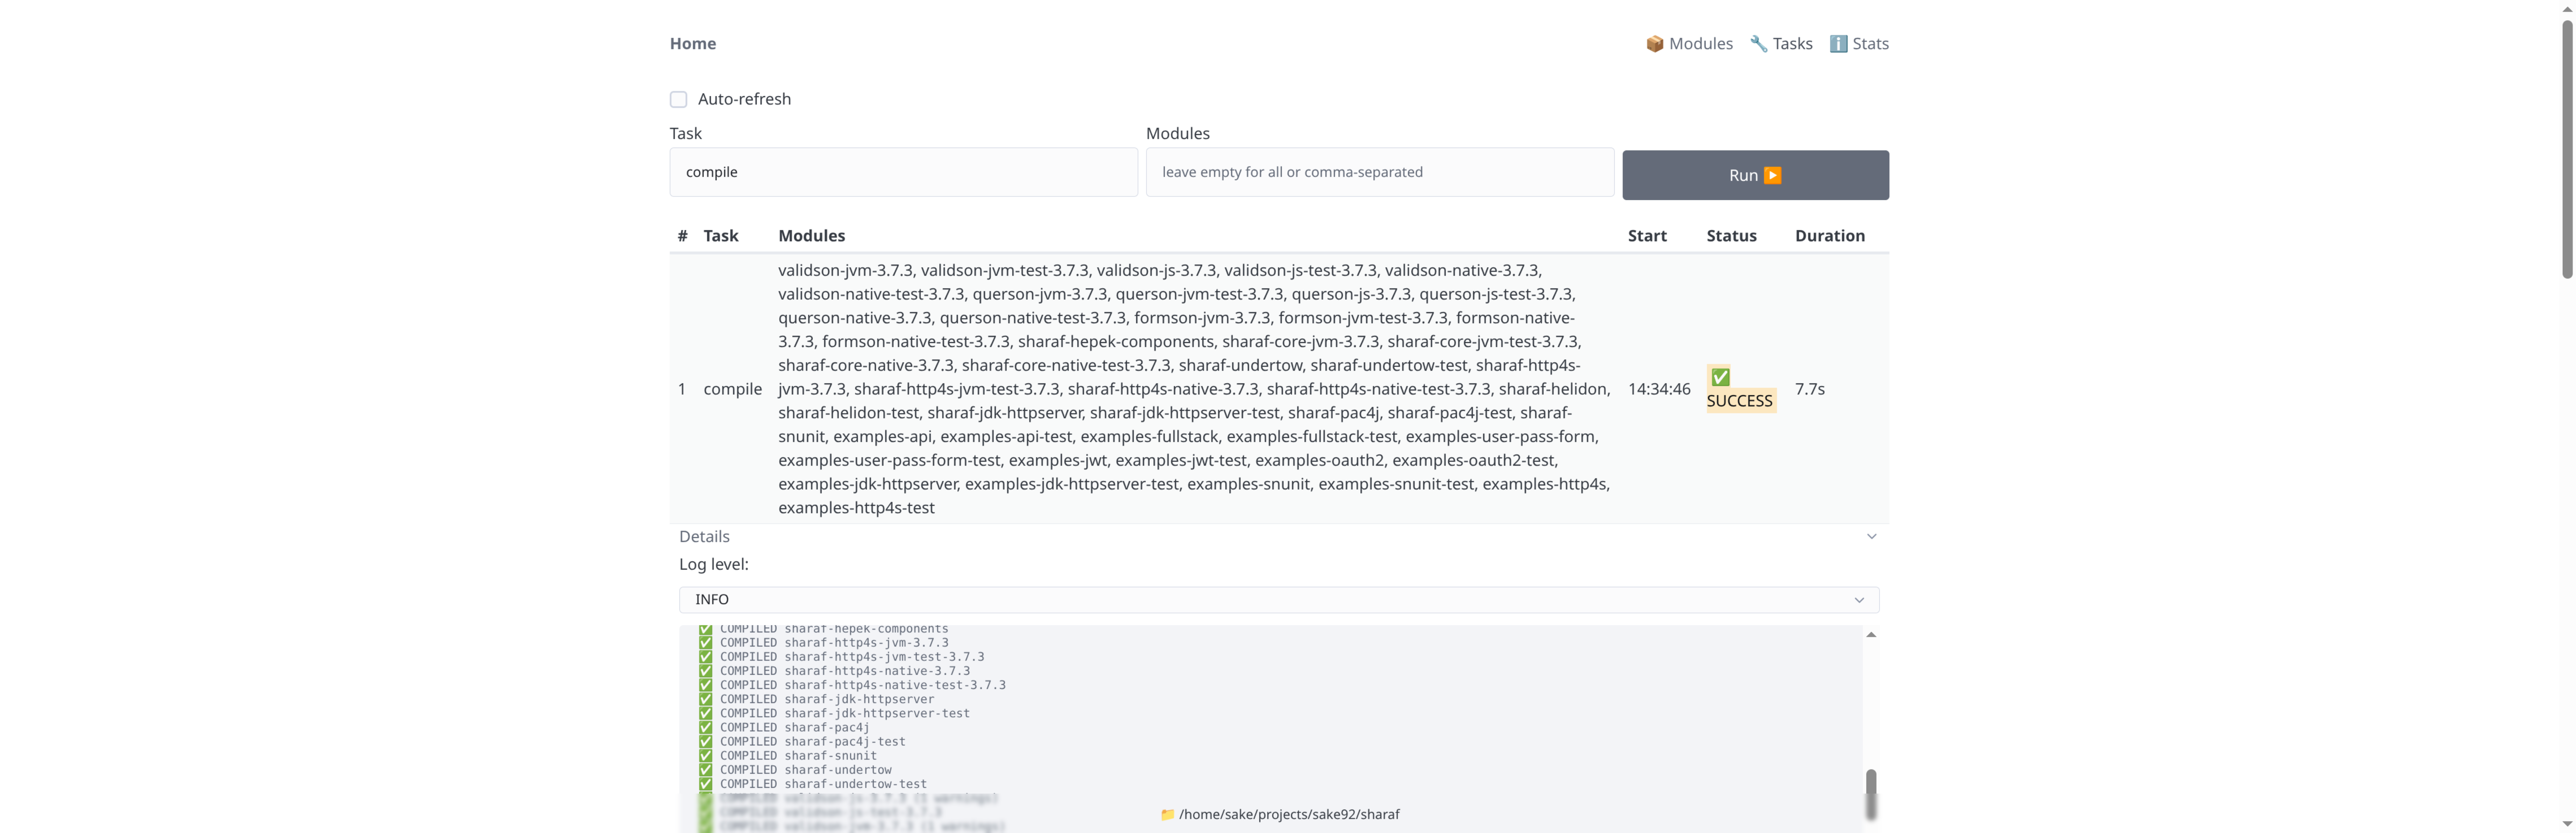
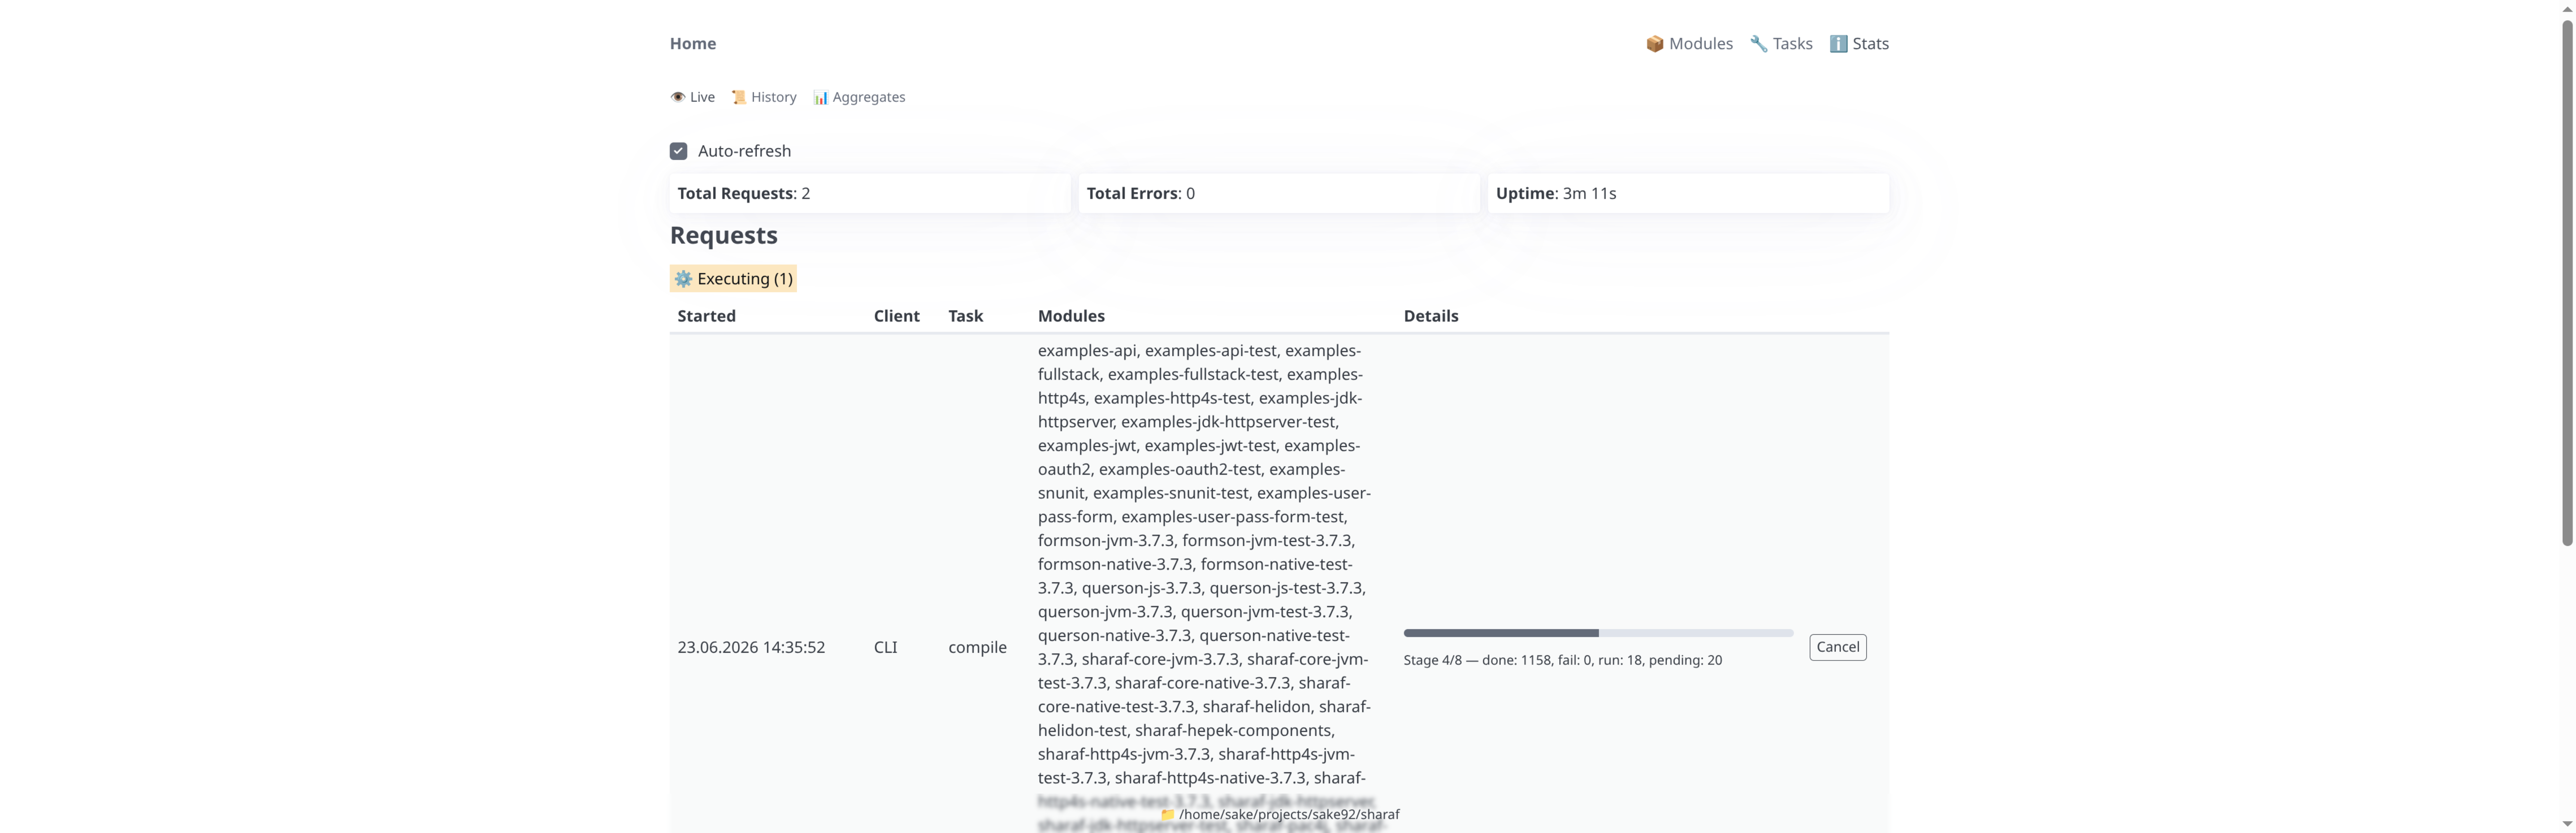
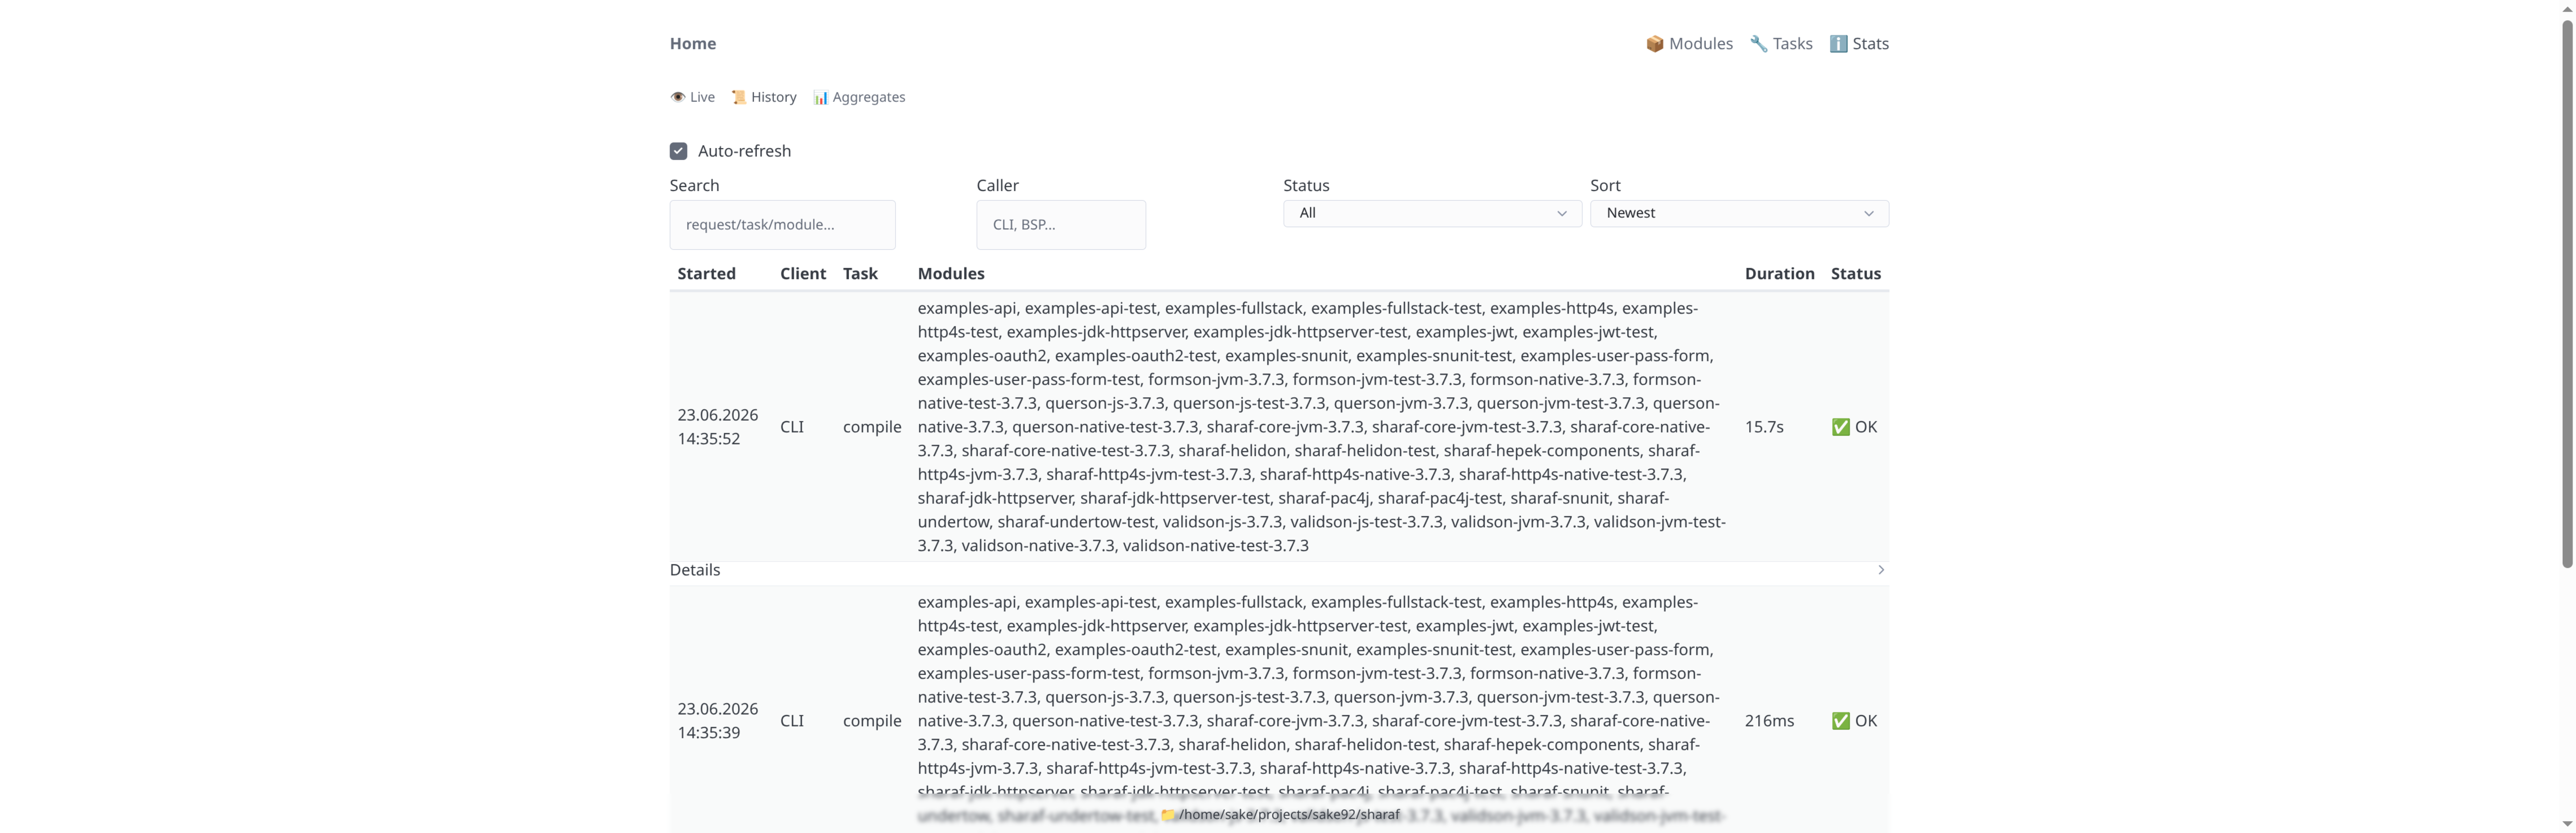
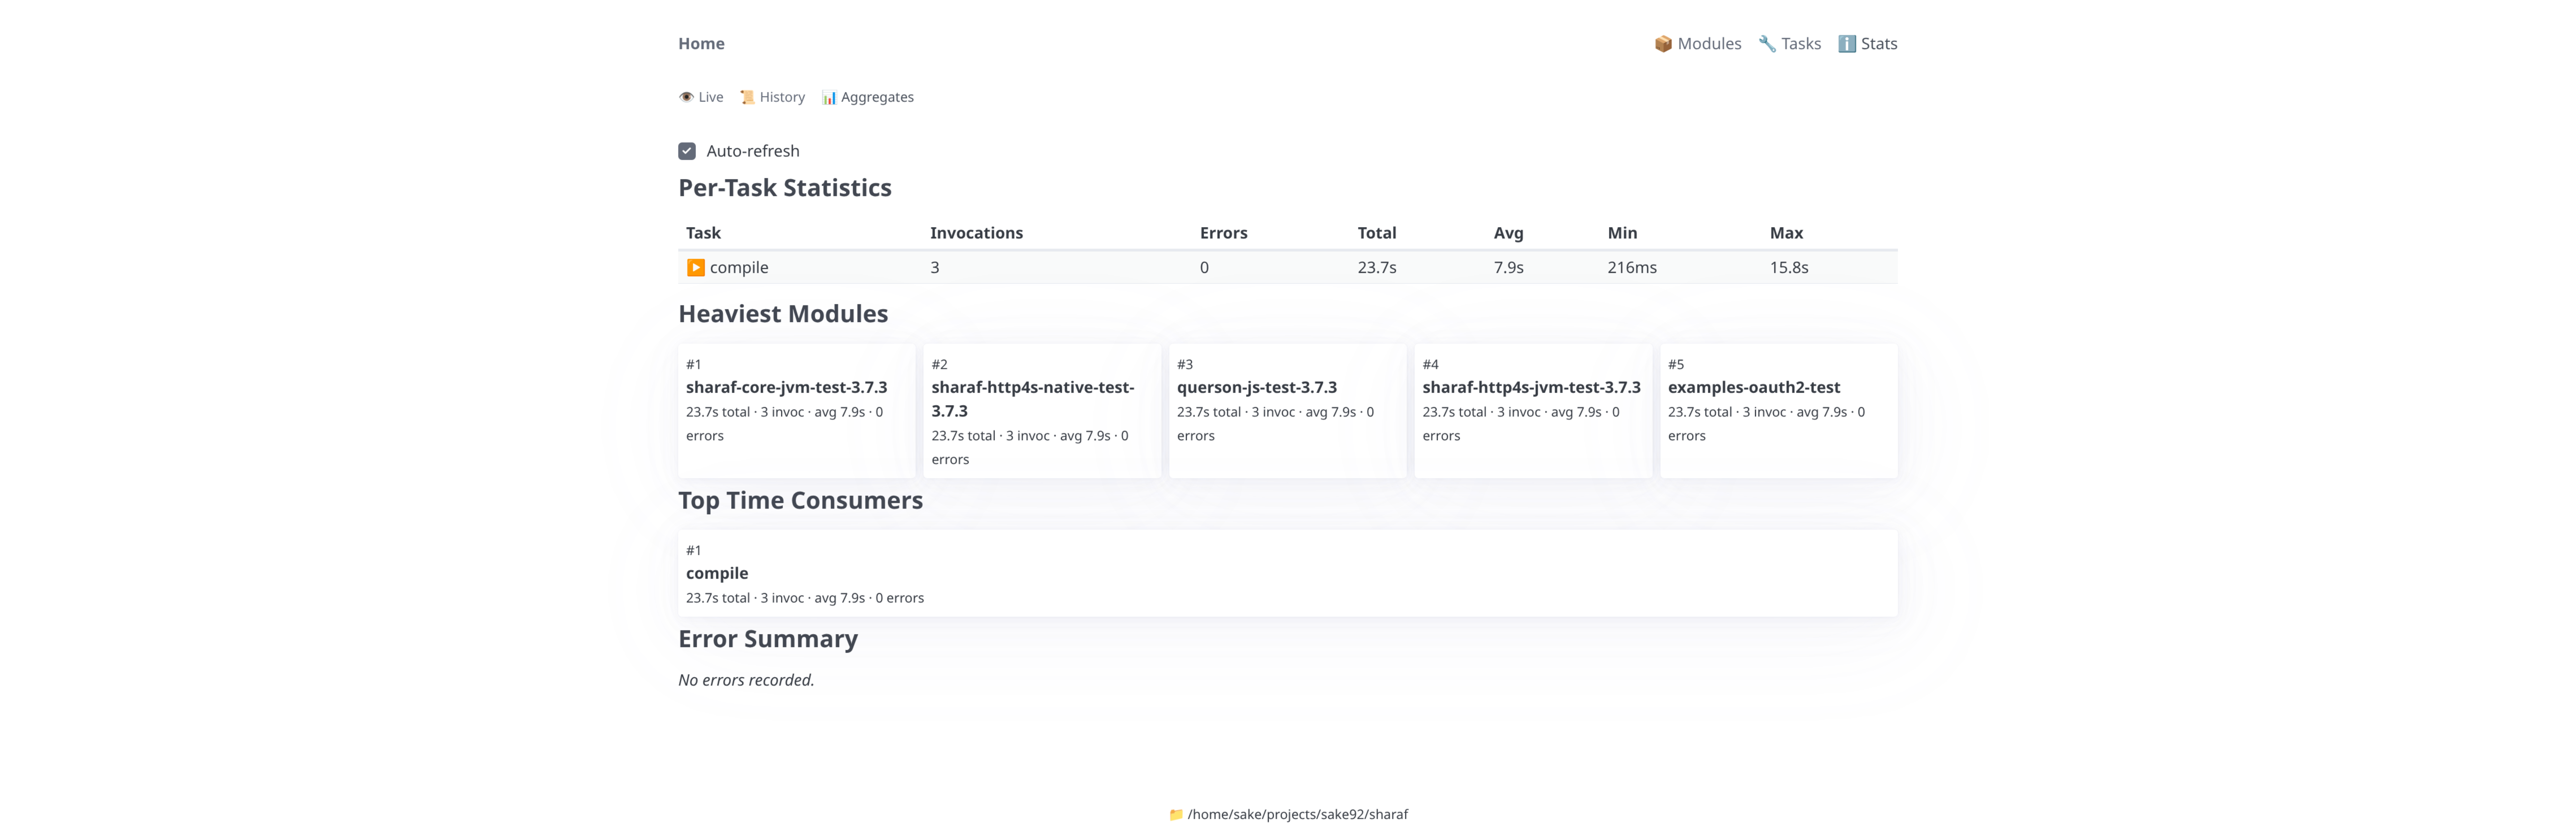
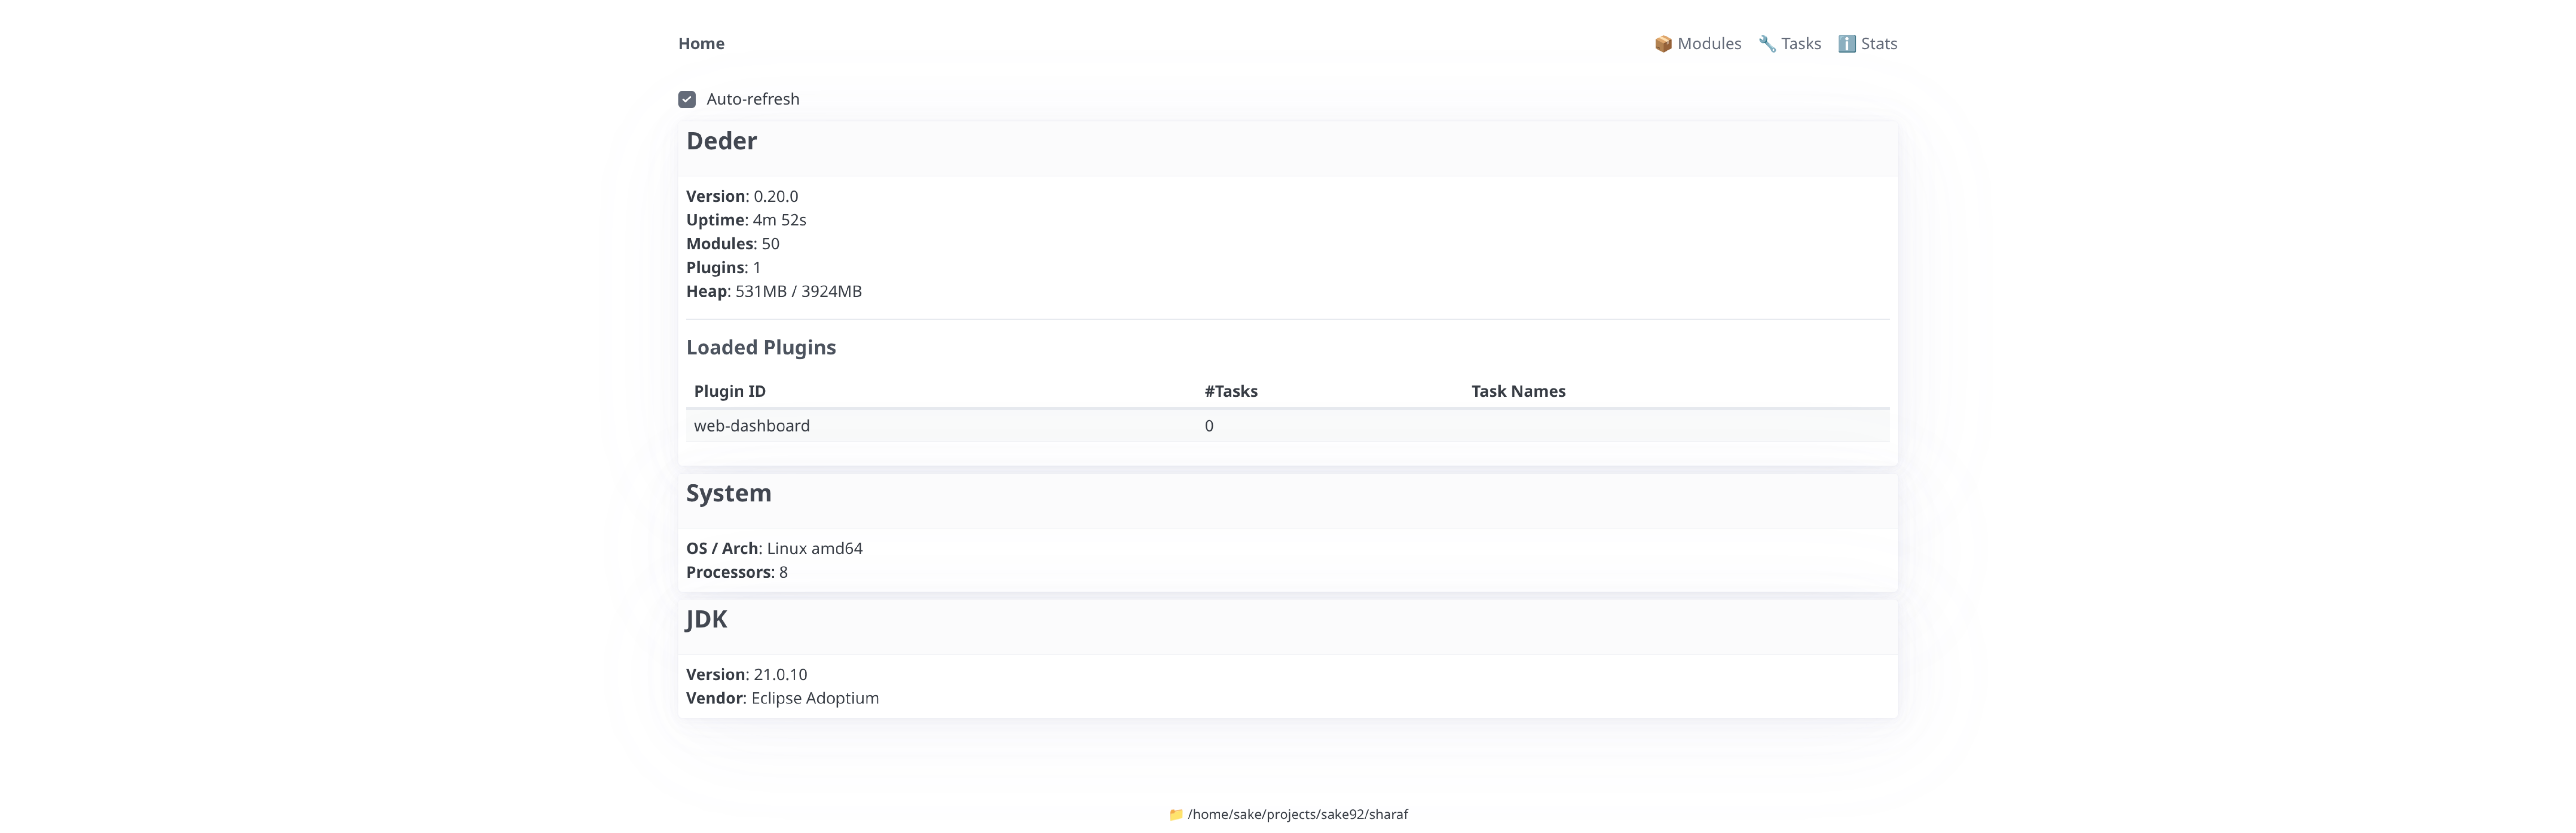
Starts an HTTP server app that shows modules info, modules graph, live stats etc.
By default it is available at http://localhost:9292
Add it to your plugins list:
import "https://sake92.github.io/deder-plugins/config/v0.4.0/WebDashboardPlugin.pkl" as WD

plugins {
  new WD.WebDashboardPlugin {}
}
Here are the defaults if you need to tweak them:
plugins {
  new WD.WebDashboardPlugin {
    config = new {
      enabled = true
      host = "localhost"
      port = 9292
      statsRefreshIntervalMs = 5000
    }
  }
}
Schema 🔗
Tasks 🔗
This plugin starts the dashboard server during plugin initialization and does not currently expose dedicated build tasks.
Screenshots 🔗