Table of Contents
OTEL tracing/logging/metrics 🔗
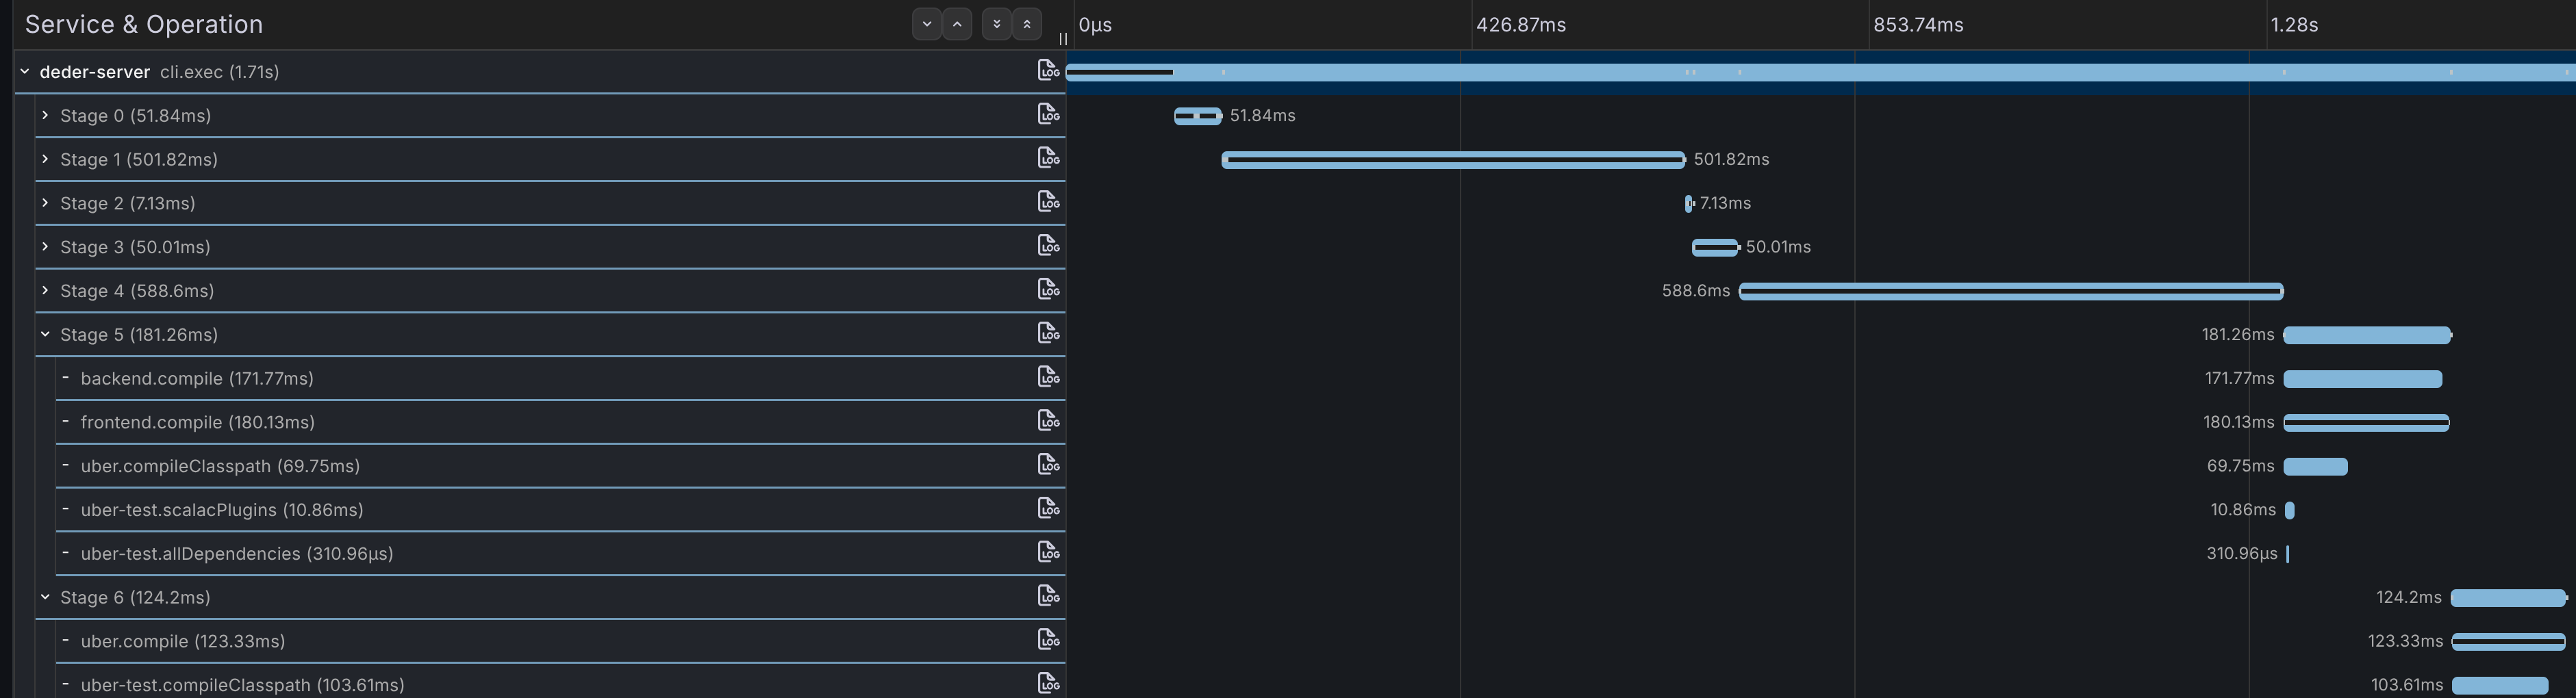
Enabling OTEL tracing in the Deder server will give you detailed traces of all the tasks executed by the server, including their dependencies and execution times. You can see exactly which tasks are taking time, which tasks are executed in parallel etc.
If your OTEL collector supports it, you can also see logs and metrics from the server, which can be very useful for debugging and performance monitoring.
Grafana LGTM 🔗
Grafana LGTM has support for traces, logs and metrics!
git clone git@github.com:grafana/docker-otel-lgtm.git
cd docker-otel-lgtm
./run-lgtm.sh
Jaeger 🔗
Jaeger is a popular open-source distributed tracing system that supports OTEL.
It only supports tracing, but it has a nice UI to visualize the traces and is very easy to set up.
docker run --rm --name jaeger \
  -p 16686:16686 \
  -p 4317:4317 \
  -p 4318:4318 \
  -p 5778:5778 \
  -p 9411:9411 \
  cr.jaegertracing.io/jaegertracing/jaeger:2.14.0
Configure Deder server to use OTEL 🔗
After starting your OTEL collector, you need to configure the Deder server to use the OTEL java agent:
curl -L -o otel.jar https://github.com/open-telemetry/opentelemetry-java-instrumentation/releases/latest/download/opentelemetry-javaagent.jar

# set the agent options in .deder/server.properties:
JAVA_OPTS=-javaagent:path/to/otel.jar -Dotel.service.name=my-project -Dotel.exporter.otlp.protocol=grpc -Dotel.exporter.otlp.endpoint=http://localhost:4317
The Deder server only depends on OTEL API, so if no agent is provided it will just run normally without tracing.