Table of Contents
TUI Dashboard 🔗
A terminal-based dashboard that displays modules, live build stats, current requests, and recent history by polling the Web Dashboard HTTP API.
Prerequisite: The Web Dashboard plugin must be running before starting the TUI dashboard. The TUI connects to the Web Dashboard's HTTP API to fetch real-time build data.
Running 🔗
The TUI dashboard is a standalone CLI application. Run it with:
deder run -m deder-tui-dashboard
By default it connects to http://localhost:9292. You can customize the server URL and poll interval:
deder run -m deder-tui-dashboard -- --server-url http://localhost:9292 --poll-ms 2000
| Flag | Default | Description |
|---|---|---|
--server-url |
http://localhost:9292 |
Web Dashboard API endpoint |
--poll-ms |
1000 |
Interval (ms) between data fetches |
Press q or Ctrl+C to quit.
What It Shows 🔗
- Header — connection URL and quit instructions
- Stats — total requests served, errors, and server uptime
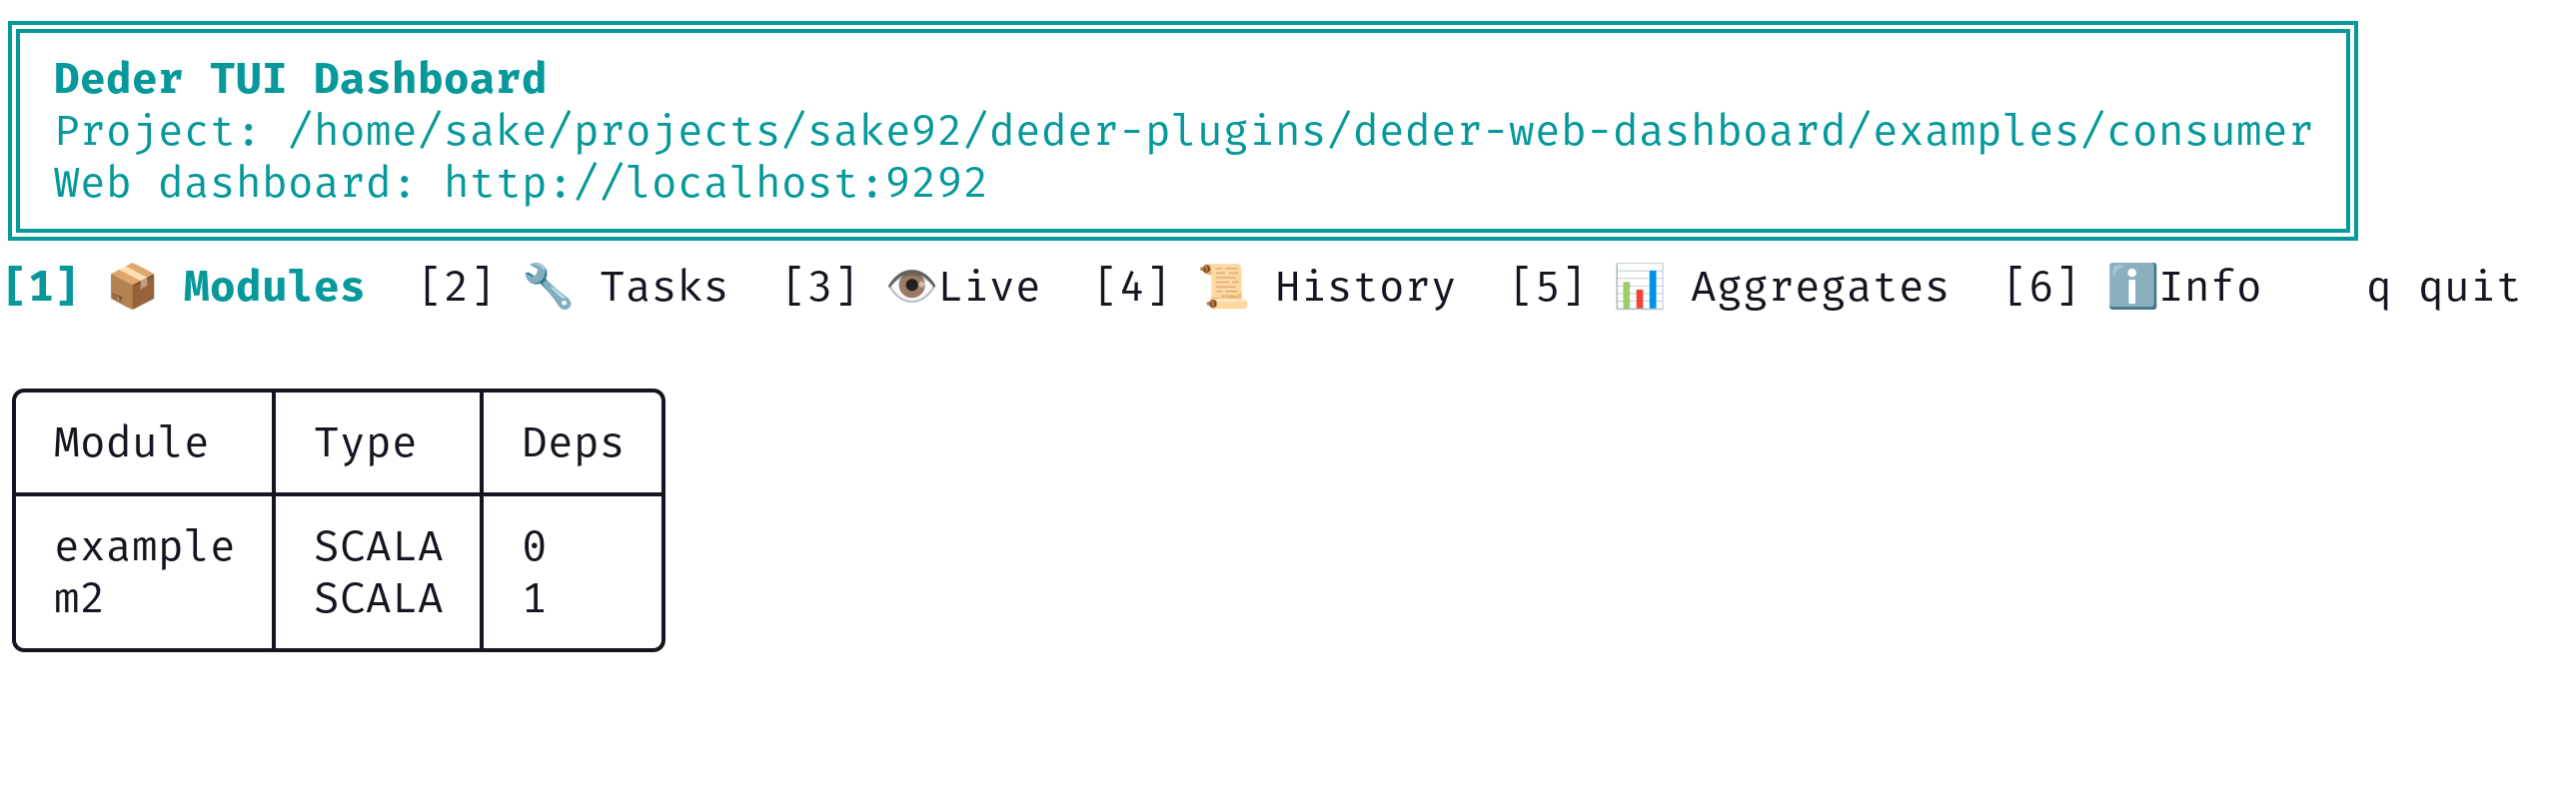
- Modules table — module ID, type, and dependency count
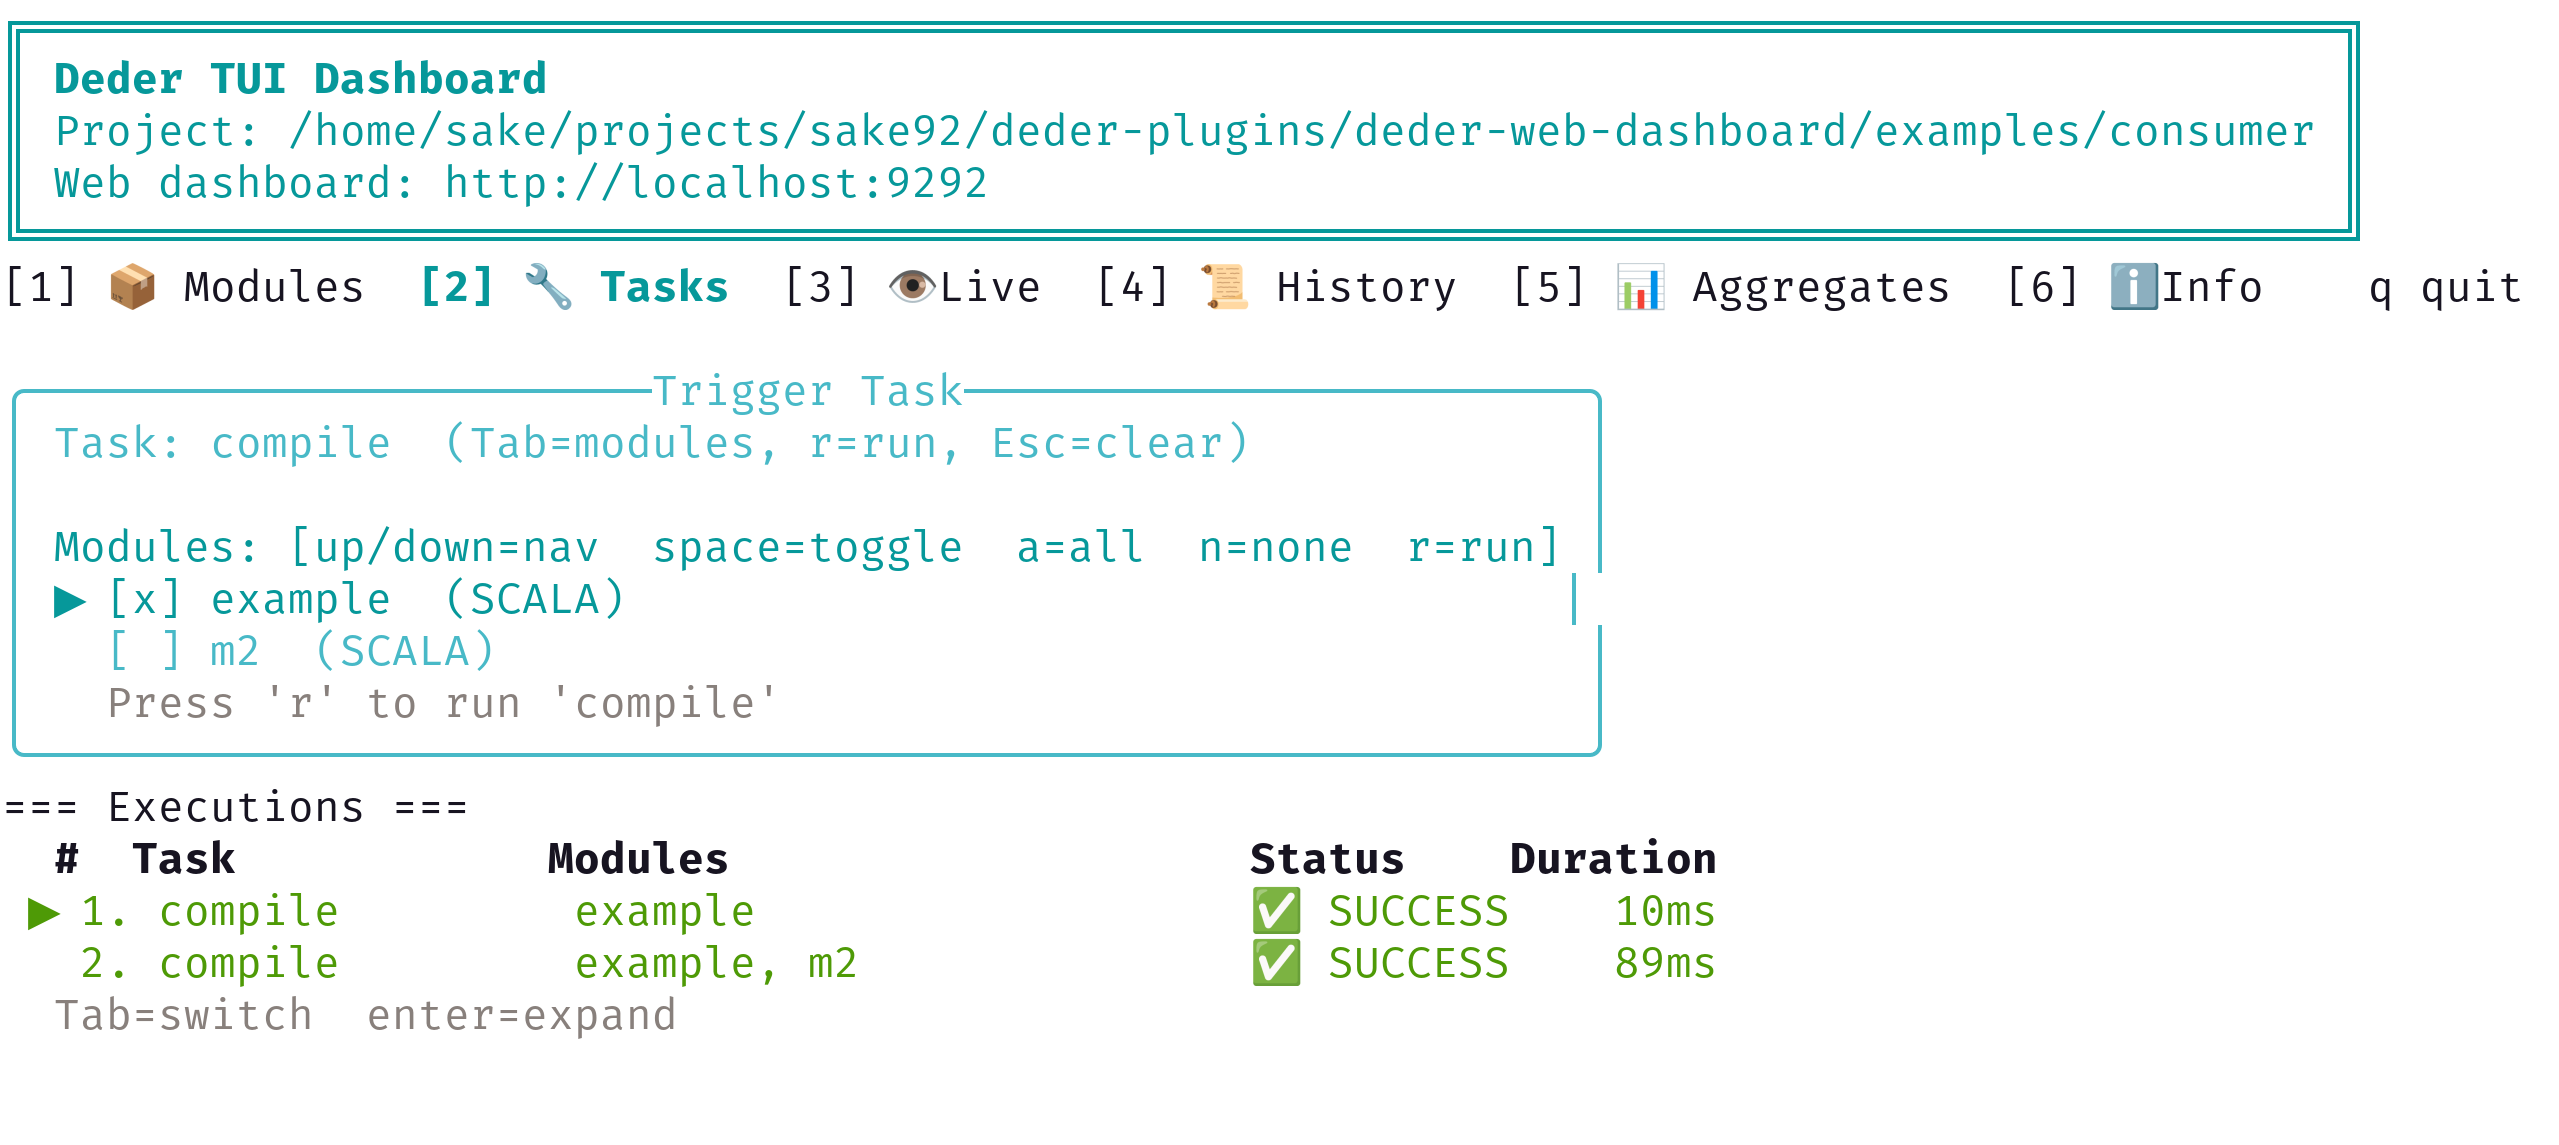
- Current Requests — tasks currently executing, with module IDs
- Recent History — recently completed tasks with success/failure status and duration
Screenshots 🔗